Nessus Reporting Customisation & Analysis
Nessus is great, but large or frequent scans get hard to manage. We built a tool to load results into a relational database for easier analysis, reporting, and automation.

If you're a security practitioner managing a Nessus instance, it can be hard to quickly answer basic questions - like whether vulnerability counts are trending up, or how many hosts are affected by a specific issue across multiple scans.
However, if you've got a limited budget and need to make do with what's available, this tool is for you.
The Tool
The tool consists of two main components:
- A database schema and associated stored procedures.
- A script to connect to the Nessus API to retrieve scan data and populate the database.
Once your data is in the database, you can slice, query, and visualise the results however you like.
Use Cases
Here are a few example use cases for the data:
- Search for specific vulnerabilities across scans (e.g. within a folder).
- Query plugin output text across all scan results to identify patterns or indicators during a penetration test.
- View trending stats across scan runs - are things trending down?
- Build a web front end or report to present tailored scan results to stakeholders.
- Write your own alerting mechanism to trigger an email or SMS when a critical vulnerability is detected.
Reporting
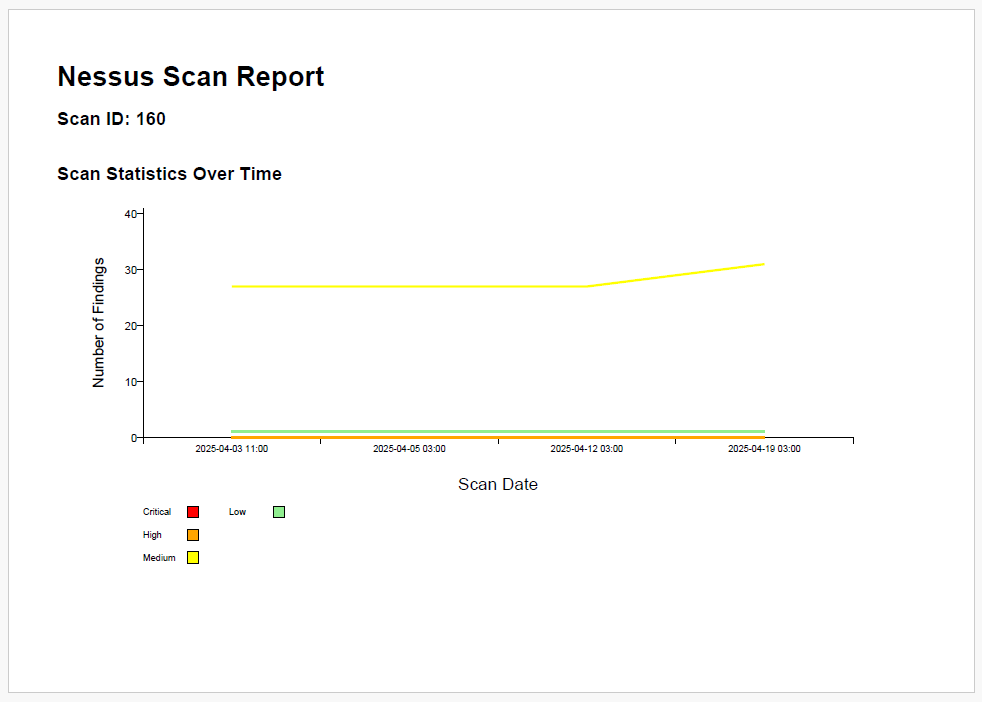
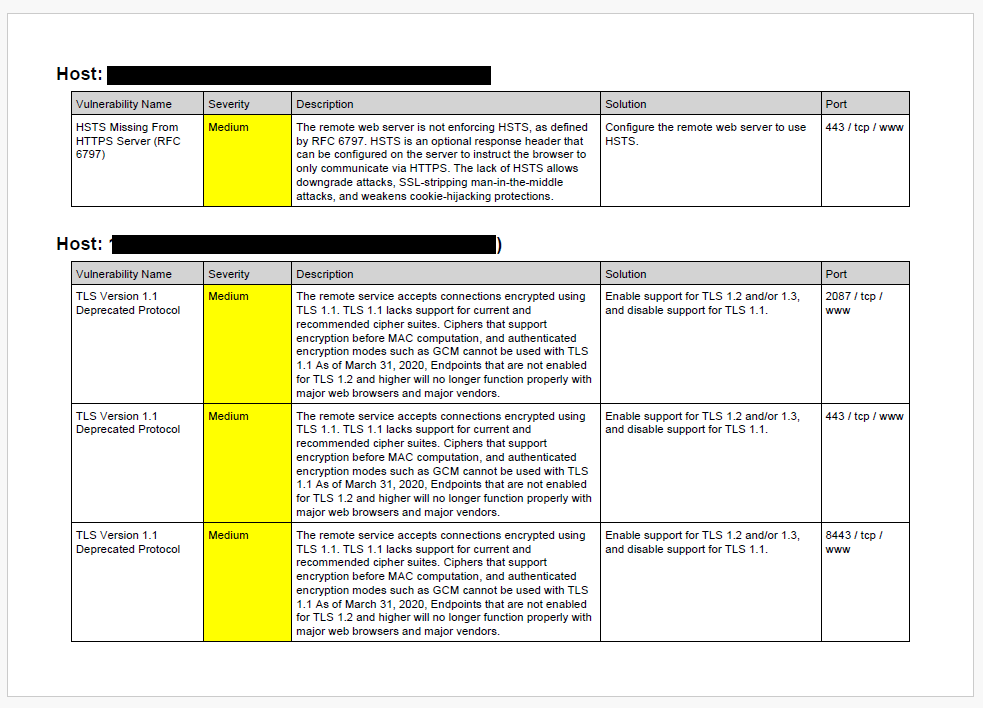
An example report generator is included in the project at: exporter/samples/report/report.py
It's far from polished, but it serves as a quick way to generate reports with trending vulnerability stats over time and grouped vulnerability findings by host. Here's what the output looks like.
Stored Procedures
In addition to this, several stored procedures are included to make querying the data easier at: database/queries/*
The reporting tool leverages several of these stored procedures.
Here's what each one does:
get_scan_results: Fetches detailed vulnerability data for a specific scan, including host information and plugin details.get_scan_stats: Retrieves summary statistics for a specific scan, including metadata and vulnerability counts.get_folder_results: Same asget_scan_resultsbut lets you retrieve all findings in a given folder ID.get_folder_stats: Same asget_scan_statsbut lets you retrieve summary stats for all scans in a given folder ID.get_compliance_results: Retrieves detailed compliance results for a specific scan, including host information and compliance data.- NOTE: compliance results are experimental as there is no official Nessus API to pull this information.
The get_folder_results procedure is the one I use most frequently. It pulls all vulnerabilities for a given folder. The procedure accepts three parameters:
folder_id: Specifies the folder to aggregate results from.plugin_id: Filters results for a specific plugin. If you don't need a filter, leave this asNULL.offset: Controls which scan run's results to retrieve. An offset of0fetches the most recent scan for each host in the folder, while1retrieves the second most recent.
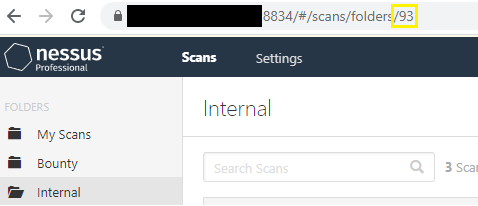
Let's say I want to find all occurrences of SSL Self-Signed Certificates in the Internal folder across all scans.
- First, I'll locate the
folder_idby checking the URL when I click on the folder in the Nessus UI.
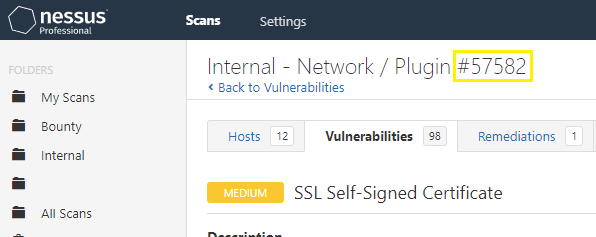
- Then, by drilling down into the vulnerability details in any scan, I can find the
plugin_idfor SSL Self-Signed Certificates.
- Finally, since I'm only interested in the most recent scan results, I’ll set the
offsetto0.
Calling the stored procedure with these parameters will give me results for SSL Self-Signed Certificates across all scans in the Internal folder, which I can then copy-paste into reports, emails, or anywhere else I need them.
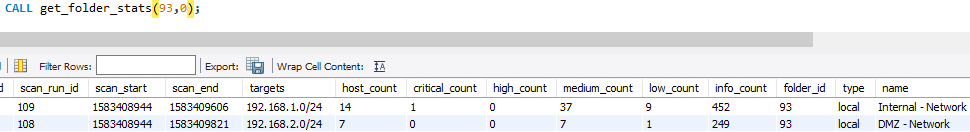
By calling get_folder_stats on the same folder_id with an offset of 0, you'll receive statistics for the most recent set of scans.