Automated Graylog Open Setup using Puppet
The term SIEM often conjures images of complex configurations and $100k bills leading to inaction. It doesn't have to be that way. In cybersecurity (and often in life), starting somewhere and taking even a small step in the right direction is preferable to standing still.

Logging is an important piece of the cybersecurity puzzle. It's so crucial that, as a part of the Australian Signals Directorate (ASD) Essential Eight, logging is a requirement for organizations at Maturity Level 2 and above.
While no set of mitigation strategies are guaranteed to protect against all cyber threats, organisations are recommended to implement eight essential mitigation strategies from the Strategies to Mitigate Cyber Security Incidents as a baseline. This baseline, known as the Essential Eight, makes it much harder for adversaries to compromise systems.
Despite this, log management solutions often carry a stigma of being hideously unaffordable or inaccessible. Let's break that stigma a bit.
This article will guide you through setting up a zero-cost Graylog Open deployment in an automated manner using Puppet. We'll focus on configuring Windows Event logs as a log source and the creation of a key security detection that many find essential.
Whether you're an IT professional embarking on your SIEM journey, or a homelab enthusiast looking to bolster your lab's security, this article should provide a solid starting point to build from.
Background
What is Graylog?
Graylog is a centralized log management solution designed for capturing, storing, and enabling the analysis of machine data. It's widely used in various environments to capture and alert on anomalous security events.
Graylog offers 3 product tiers:
- Graylog Security
- Graylog Operations
- Graylog Open
In this guide, we'll focus on Graylog Open, which does not require a license and is free to use.
Install
Basics
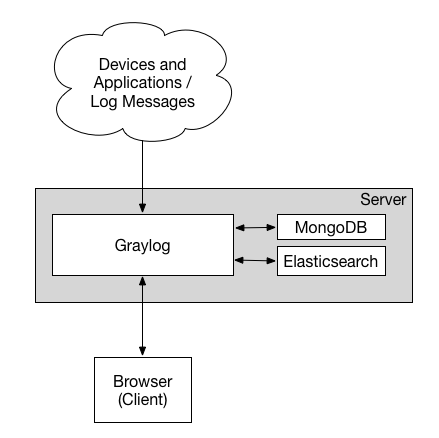
A Graylog deployment consists of 3 components:
- Graylog Server
This serves the web UI/API, and is how you interact with Graylog. From configuring inputs, alerts, indexes, to dashboards. - Opensearch (previously Elasticsearch)
Opensearch is where your logs are actually stored, and indexed. - MongoDB
This is used to store Graylog metadata.
For our setup, we'll be installing all 3 components on a single server thereby creating a single-node Graylog deployment.
It can be argued that even basic Graylog deployments should be multi node. However, I believe that:
- It's easier to scale up than scale out.
- Building a single-node deployment doesn't prevent you from scaling out later.
- For those just starting out or learning, the complexities of multi-node setups might be overwhelming and unnecessary. It's better to avoid too much analysis paralysis.
Preparing a VM
Provision a single Ubuntu Server 20.04 (note: version 22.04 currently has compatibility issues with a module we're using). The VM should meet the following hardware specifications:
- 4-8 vCPU
- 8GB RAM
- 100GB SSD/High IOPs Storage
The storage requirements depend on your expected daily log volume and how long you need to retain these logs. For instance, if you anticipate around 5GB of logs per day, a 100GB storage (excluding space for the OS and other software) would allow for approximately 20 days of log retention. You can allocate more storage if necessary.
To give you an idea of the expected log volumes:
- Most lab environments produce less than 0.3GB of logs per day.
- In a carefully managed production environment, around 200 Windows workstations, 4 domain controllers, and approximately 20 domain member servers can generate less than 5GB of logs per day.
Our suggested hardware setup should be sufficient for handling up to 2-4GB of log data per day. While official sizing guidelines are more conservative, our requirements should serve well for this range of data.
Automated Install using Puppet
What is Puppet?
Puppet is a tool that helps you manage and automate the configuration of servers.
When you use Puppet, you define the desired state of the systems in your infrastructure that you want to manage. You do this by writing infrastructure code in ... Puppet Code.
Puppet code is declarative, which means that you describe the desired state of your systems, not the steps needed to get there.
Puppet then automates the process of getting these systems into that state and keeping them there. Puppet does this through Puppet primary server and a Puppet agent.
Reference: https://www.puppet.com/docs/puppet/6/puppet_overview.html#what_is_puppet
Typically, Puppet operates in a client-server setup, with a Puppet server managing multiple Puppet agents installed on target systems. However, for the purposes of this tutorial, we'll simplify things. We're going to use just a Puppet agent to apply Puppet code directly on the host.
Downloading Dependencies
Start by installing the Puppet agent, apache2-utils and also the third party Puppet modules used to setup and configure everything.
# Download the dependency install script.
wget https://gist.githubusercontent.com/eddiez9/52daab1609e27efb429b605bf6c8ec3a/raw/13774b461285255bb0d1a3561b2d39286ac78089/install-tools.sh

# Make it executable and then execute it
chmod +x install-tools.sh
sudo ./install-tools.sh
The puppet modules we need are being installed into 2 separate directories, 1-modules and 2-modules. This is done to avoid dependency conflicts between modules we are using.
OS Configuration/Opensearch Install
Next we can start using Puppet Code to apply various configurations and install Opensearch. Let's take a close look at what is being done.
This puppet code will:
- Set the timezone to UTC.
- When Graylog is unable to determine the timezone contained in a log message, Graylog will use the OS timezone configuration. It's recommended to set this to UTC for these circumstances.
- Configure NTP to ensure time sync is accurate.
- When it comes to forensic investigations, determining the sequence of events is easier when log timestamps from different devices are reliable.
- Adjust kernel parameters to those recommended by Opensearch.
- Install and configure Opensearch with authentication.
- Opensearch is configured to listen only on localhost.
- It's configured to use 4GB of RAM (recommended 50% of system memory).
- An admin account is created with the username of 'graylog_os_user' and a password of 'password', by default opensearch nodes do not have authentication.
You will need to make 2 adjustments to this before applying this puppet code.
- Adjust the NTP servers specified to match those used by other devices in the environment (see servers field).
- Change the password for 'graylog_os_user' (see hash field).
To generate a new bcrypt hash to represent your password, use the following command and replace 'password' with your new password.
htpasswd -bnBC 12 "" password | tr -d ':\n'
# Download the puppet code
wget https://gist.github.com/eddiez9/94c3b9f042d3a1a3f06488e7ac7099ee/raw/2deb3d009b0b0979d6379be8192ccbbebc489929/1-manifest.pp
# Make your modifications
nano 1-manifest.pp
# Sit back and apply the puppet code
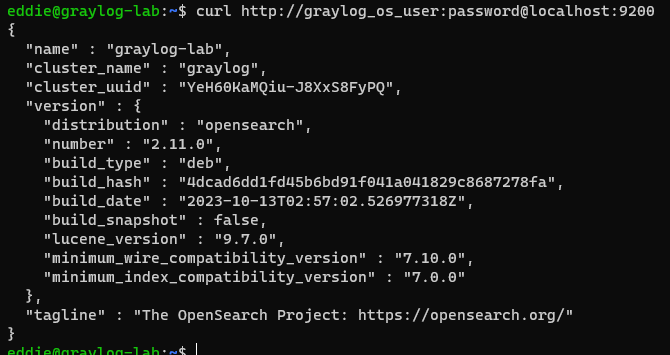
sudo /opt/puppetlabs/bin/puppet apply 1-manifest.pp --modulepath=./1-modulesWith a bit of luck, you should now have a working Opensearch install that requires authentication. You can verify this using this command (replacing the password with the one that you set).
curl http://graylog_os_user:password@localhost:9200
MongoDB/Graylog Install
Finally, we can install MongoDB and Graylog. Almost there!
This snippet will:
- Install and configure MongoDB.
- MongoDB will be configured to only listen on localhost.
- 1 database will be created (graylog_mongodb).
- 2 users will be created, an admin user (used for administering MongoDB), and a lower privilege user with all rights for the graylog DB (used by Graylog).
- Install and configure Graylog.
- Graylog will be configured to listen on all interfaces on port 9000 without SSL.
- It will connect to MongoDB and Opensearch over their respective localhost ports with authentication.
There are a couple of things you'll want to change:
- MongoDB admin password (see admin_password field).
- MongoDB low privilege user password (see password field under mongo::db).
- Graylog password_secret.
- This field is used for password encryption/salting. Generate one using this command:
< /dev/urandom tr -dc A-Z-a-z-0-9 | head -c${1:-96};echo;
- This field is used for password encryption/salting. Generate one using this command:
- Graylog admin login password (see root_password_sha2 field).
- This field sets the WebUI login password for the first account.
- To generate a new SHA2 hash to represent your password, use the following command:
echo -n "Enter Password: " && head -1 </dev/stdin | tr -d '\n' | sha256sum | cut -d" " -f1
- Connection string for Opensearch (see elasticsearch_hosts field).
- Update the connection string for Opensearch to use the password you set in the previous section.
- Connection string for MongoDB (see mongodb_uri field).
- Update the connection string for MongoDB to use the password you set in step 2.
# Download the puppet code
wget https://gist.githubusercontent.com/eddiez9/6877eeb86c01d1c695dbe75622180d4e/raw/09b13085fa864a9cf02717e6da3ab288baf10db4/2-manifest.pp

# Make your modifications
nano 1-manifest.pp

# Pat yourself on the back again and apply the puppet code
sudo /opt/puppetlabs/bin/puppet apply 2-manifest.pp --modulepath=./2-modules
Login 🎉🎉🎉
Assuming everything has worked so far, you should now be able to browse to the IP address of your Graylog server over port 9000.
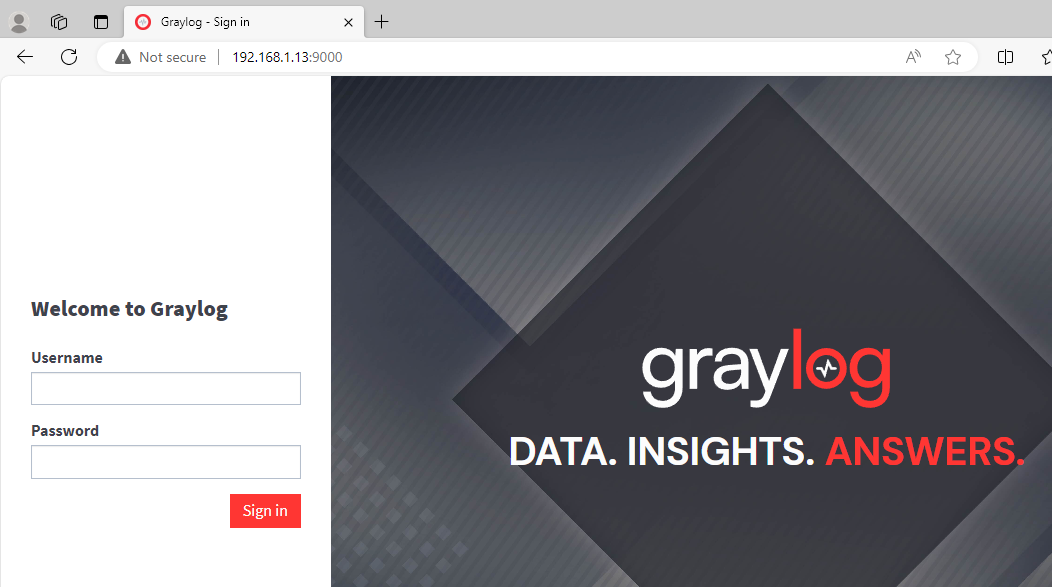
Log in using the username of 'admin' and the password that you set at 'root_password_sha2'.
Log Source Configuration
Our next duties are to get some logs flowing into Graylog. We'll be focusing on Windows event logs from a domain controller as our first log source. But first, a bit of context.
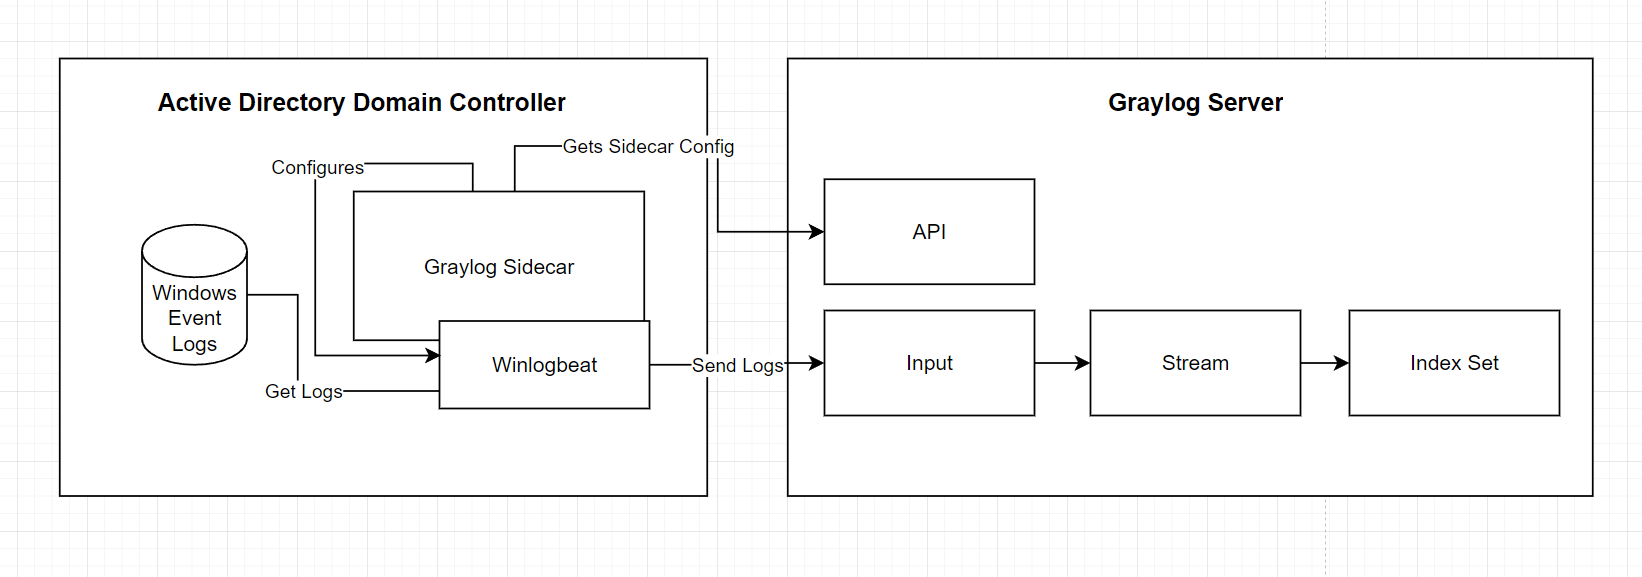
From right to left:
- Index Sets
- Graylog abstracts underlying Opensearch indices and allows you to manage index sets.
- Index sets should be created per log type for two main reasons.
- Retention settings, you can consider configuring low value high noise log sources to have a short retention configuration.
- Performance, having a large number of data types and fields in one index can affect query performance.
- Streams
- Streams can be used to direct where a subset of logs are going.
- Today we'll just be using a Stream to direct our logs into our Windows Event log index set.
- Inputs
- Inputs accept log messages, you configure what port and what type of listener for Graylog to start.
- Graylog Sidecar
- Sidecar is a nifty configuration management system for log collectors (e.g. Winlogbeat).
- Winlogbeat
- Winlogbeat is an open source tool for collecting/sending Windows event logs.
Graylog Configuration
Index Set, Input and Stream Creation
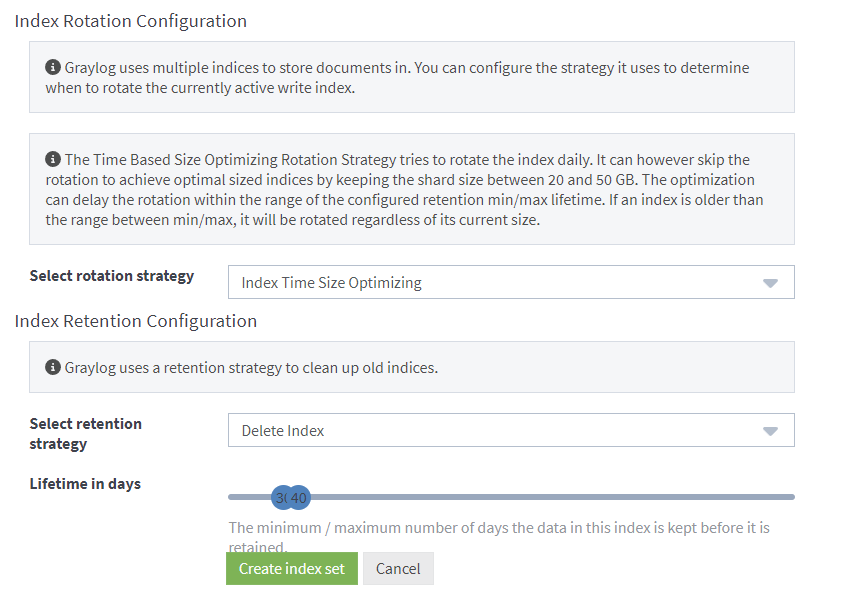
Create an index set for our Windows logs by browsing here.
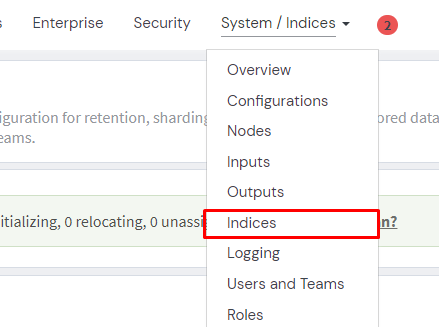
Press the Create index set button.
There's only 3 pieces of configuration we'll worry about right now, these are Title, Description, Index Prefix and Index Retention Configuration.
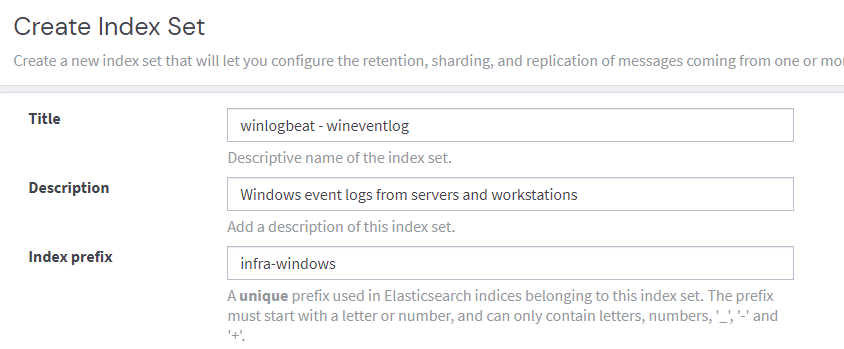
Indexes form a part of an index set. Graylog will try to rotate an index daily. If for example, you have 5GB per day of log volume, you can adjust the maximum age of an index to 20 days to ensure you stay under 100GB or storage. This setting can be changed after the fact so it can be left default for now if you're unsure.
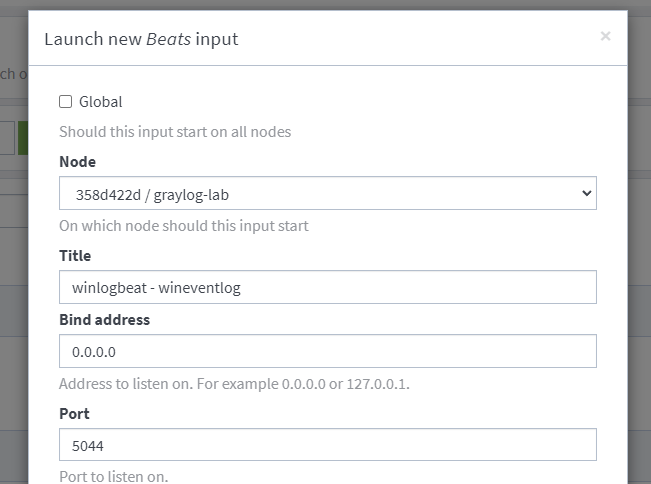
Create an input for winlogbeat.
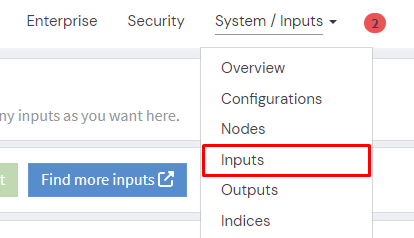
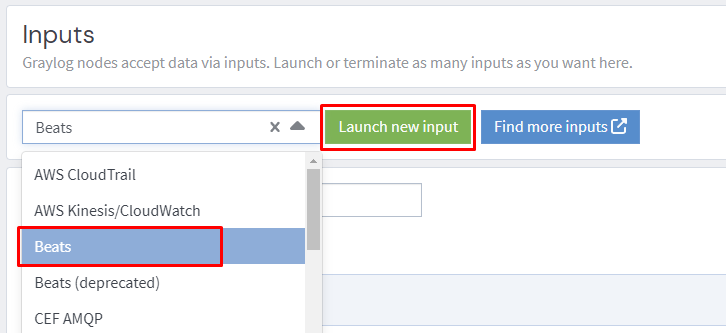
Create a descriptive title and click that Launch button!
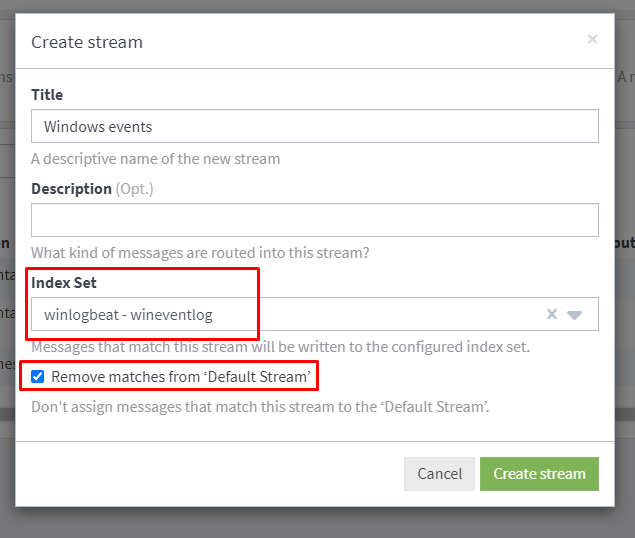
Finally we need to create a stream.
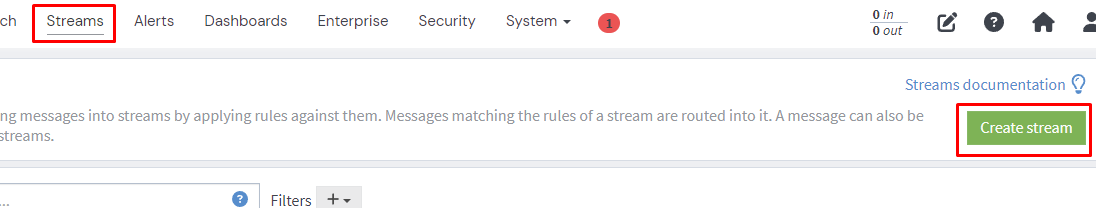
Be sure to select the index set we created.
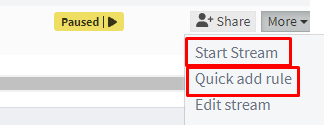
Start the stream and add a Stream rule to define which messages should be routed to this Stream.
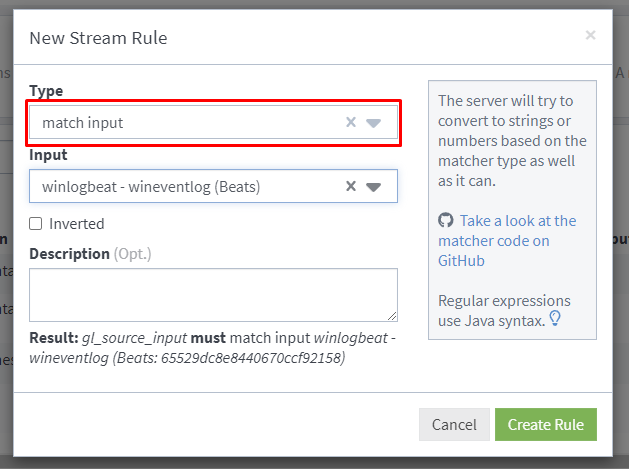
Select stream rule type of 'match input' and select the input we created earlier.
Graylog Sidecar and Winlogbeat Configuration
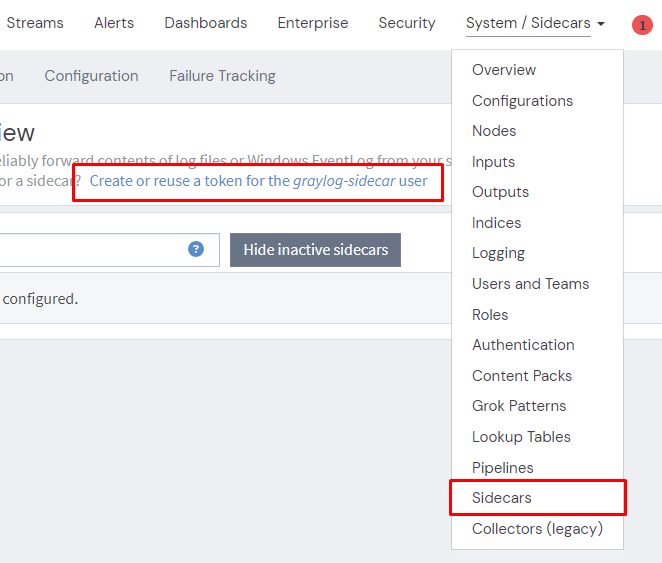
Now onto Graylog Sidecar configuration.
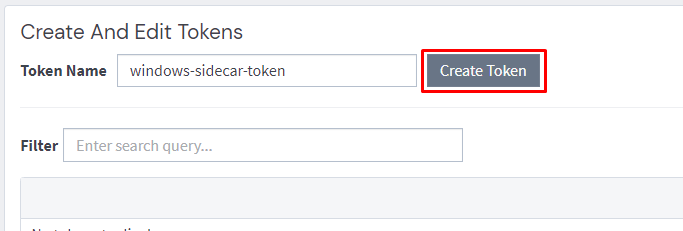
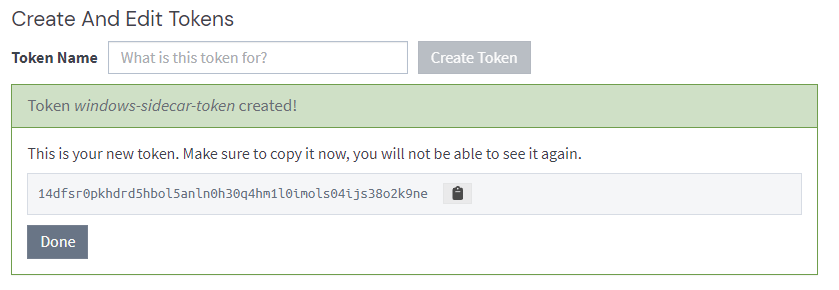
The first thing we need to do is create a Sidecar API token.
Note down the output as you cannot retrieve it again once created.
The default Winlogbeat collector configuration that Graylog ships with collects all Application, System and Security logs from Windows Event Log. While this would work, we'd be collecting a lot of logs that may not be useful for security thus consuming lots of storage and compute.
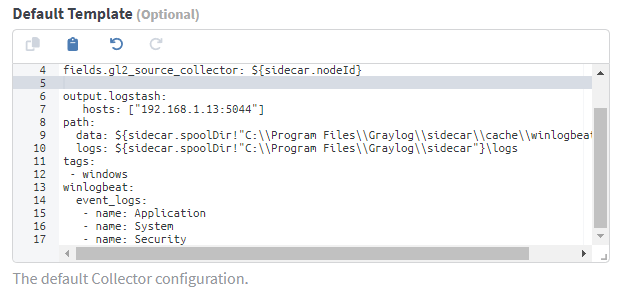
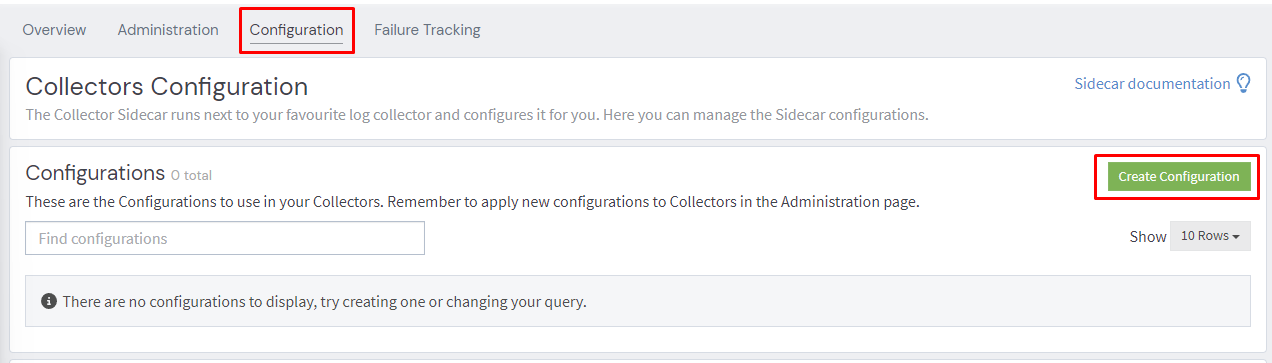
Create a configuration for Winlogbeat.
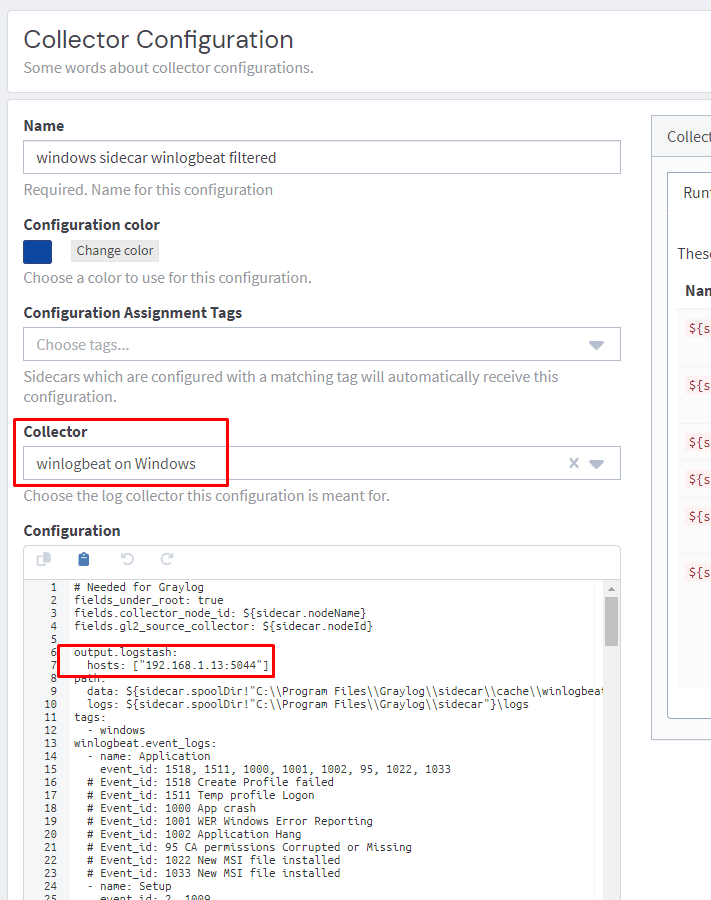
In the configuration section, you can use this sample configuration (adapted from https://github.com/humio/security_monitoring/blob/master/winlogbeat.yml). Make sure you update the hosts section with the IP address of your Graylog node.
 262588213843476
Installing the Graylog Sidecar and Applying Configuration
Download the latest version of the Graylog Sidecar onto your Domain Controller.
 Graylog2
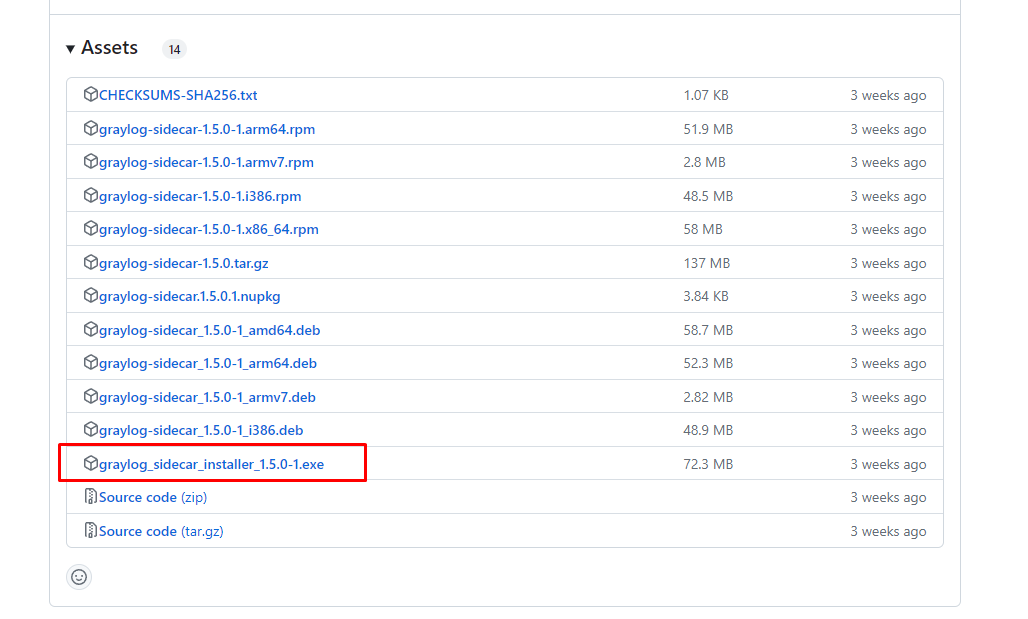
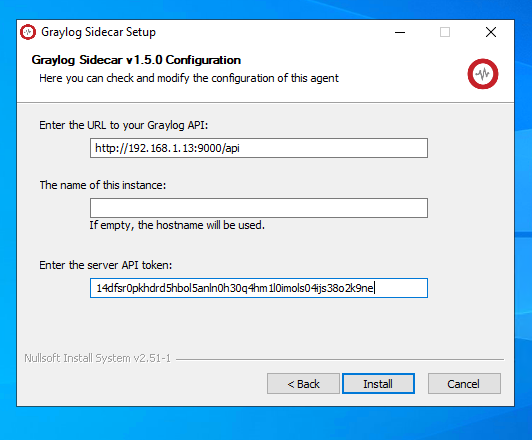
Run the installer, at this screen on the installer substitute the IP address of your Graylog server into the IP Address field, and fill in the API token with the one generated from earlier.
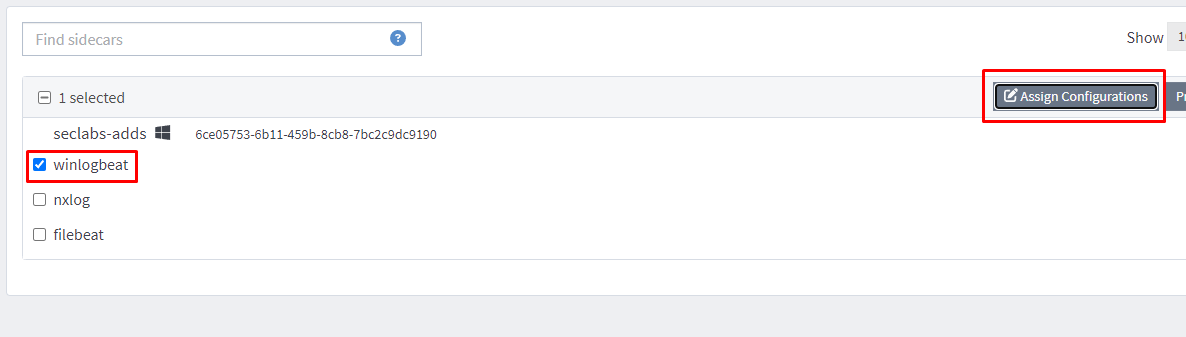
Assuming you have network connectivity between your domain controller and the Graylog server, the collector should now appear under the administration tab.
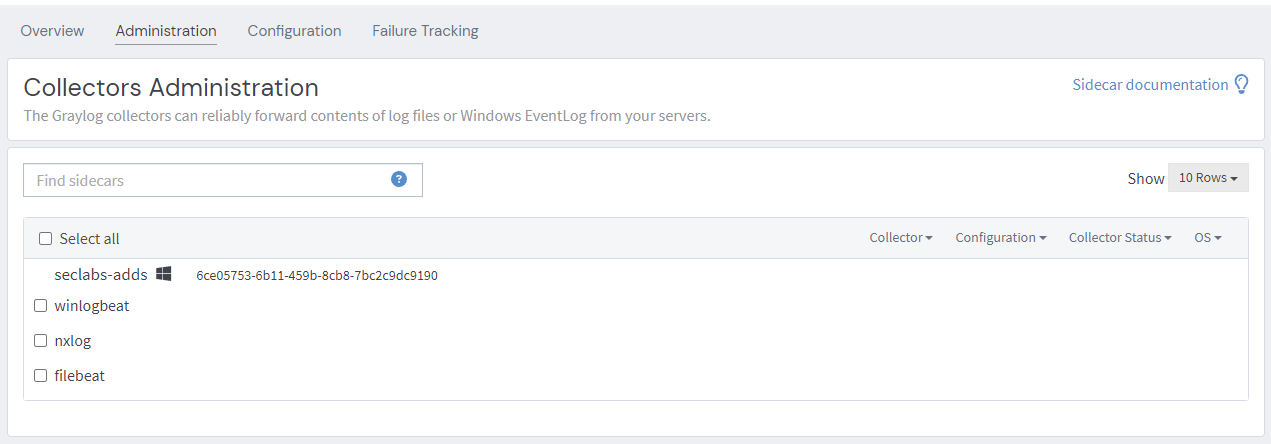
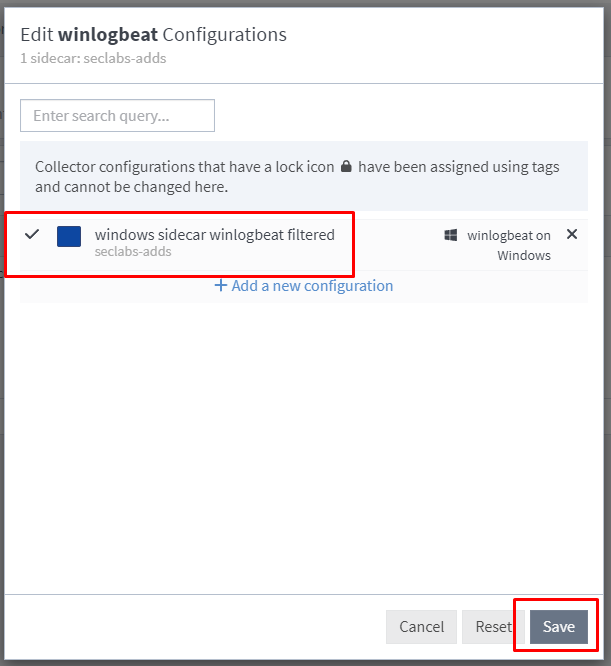
Assign the configuration we created earlier and we should have logs flowing.
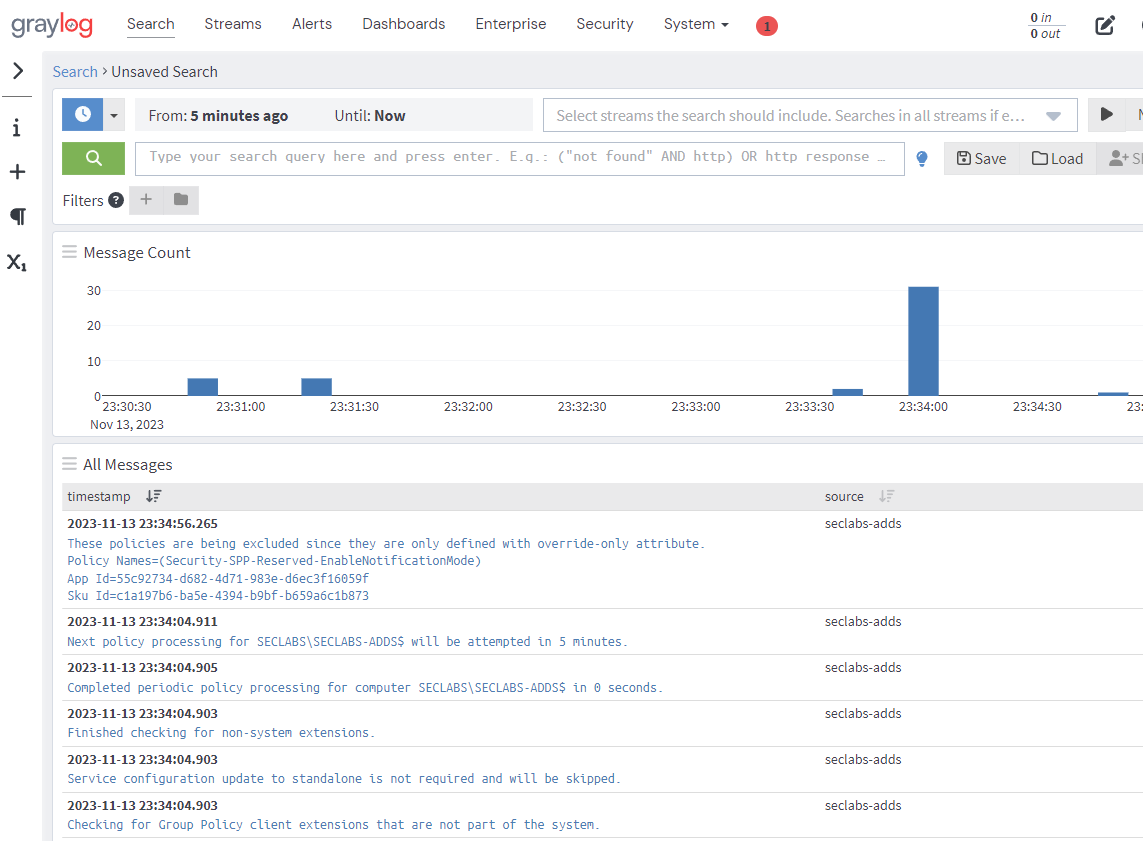
Success
If we browse back to the Search tab we should now see logs.
Detections
Home stretch now, you got this! With some logs flowing from a domain controller, we can now setup a basic detection to demonstrate the system working.
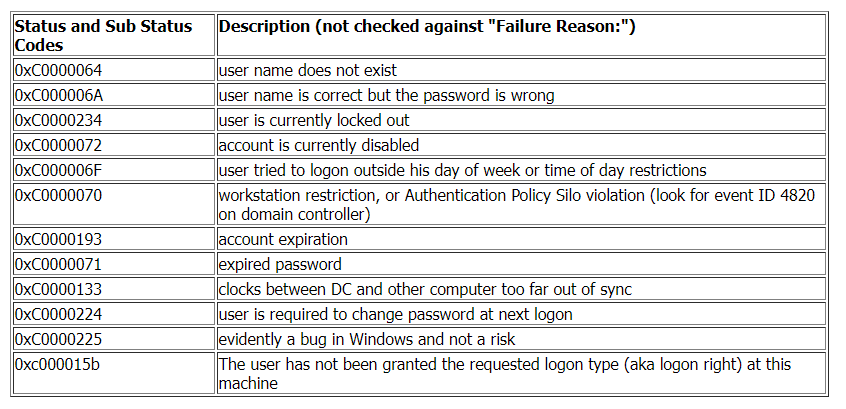
Windows Event Code 4625 details a failed login event. This event also provides information about the reason why the login failed.

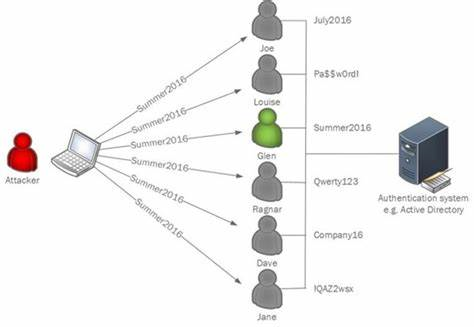
To avoid tripping Account Lockouts in traditional brute force attacks, attackers commonly opt for password spray attacks.
Instead of trying many passwords for one account and causing multiple consecutive failed logins for the one user, in a password spray attack, a single password is attempted for lots of user.
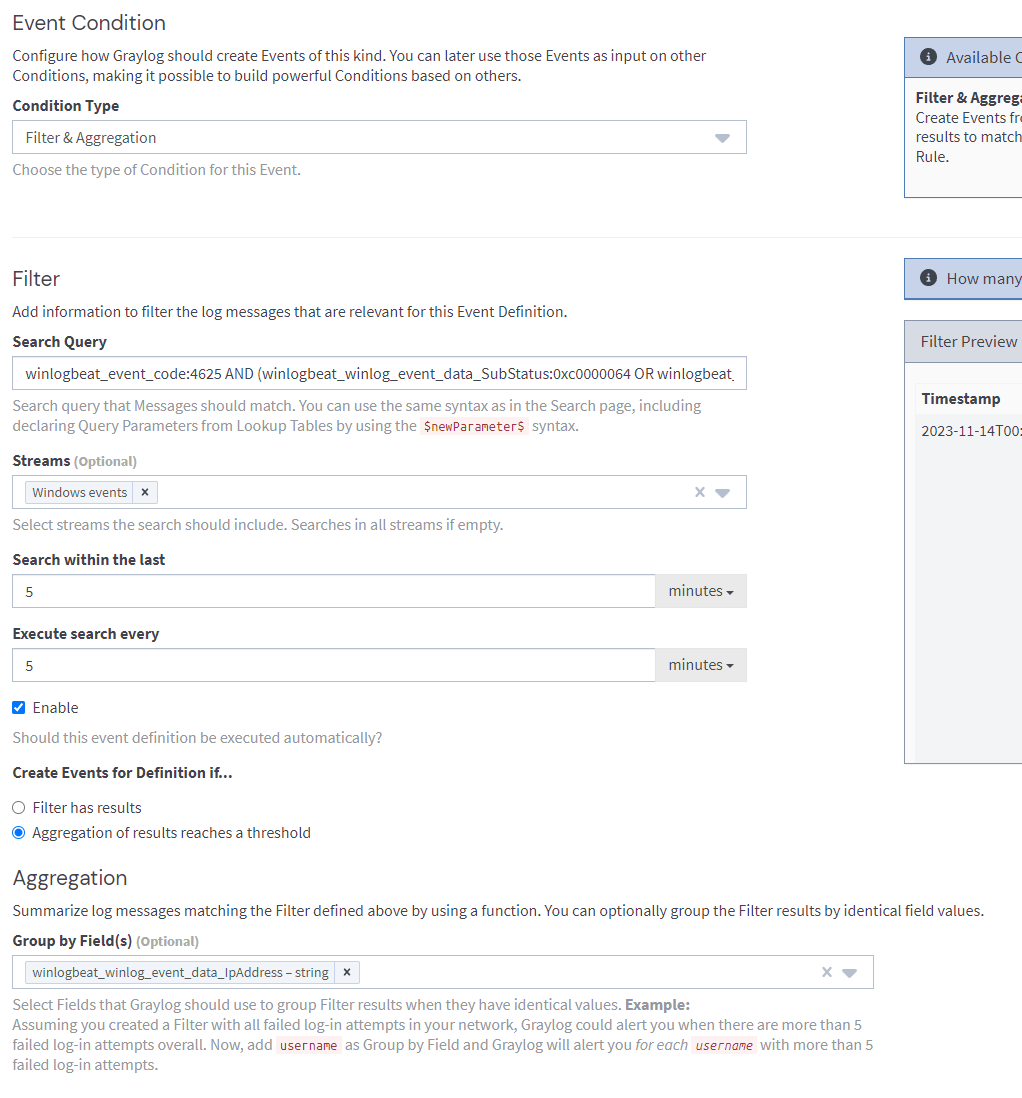
Lets try to detect this behaviour with a query.
winlogbeat_event_code:4625 AND (winlogbeat_winlog_event_data_SubStatus:0xc0000064 OR winlogbeat_winlog_event_data_SubStatus:0xc0000072)
The query above will look for failed login event logs where the failure reason either 'the username does not exist' or 'the account is currently disabled'.
These two failure reasons can be good indicators for password sprays because attackers typically compile user lists for password spray attacks using sources like LinkedIn:
- They may not know the username format which would lead to lots of authentication failures with failure reasons of 'the username does not exist'.
- They don't know which accounts are enabled or disabled which could lead to failed logins against disabled accounts.
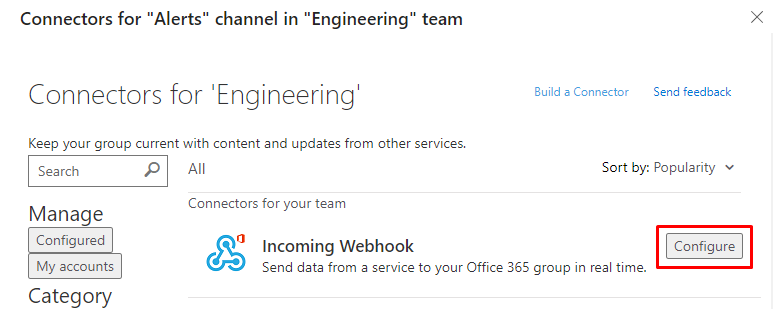
Creating a Notification Mechanism
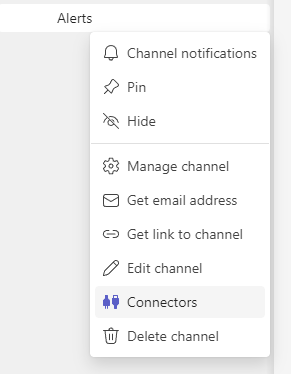
Setup a Teams channel to receive alerts.
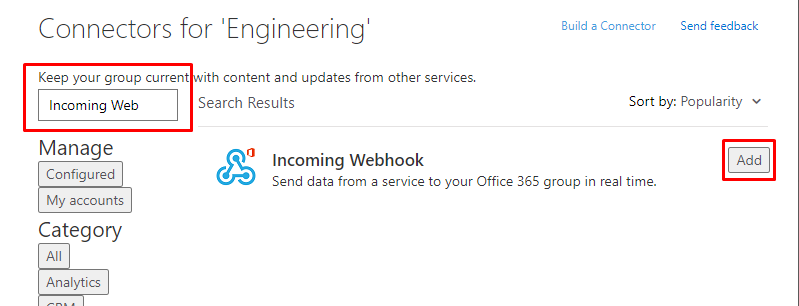
Once it has been added, return back to this screen to configure it.
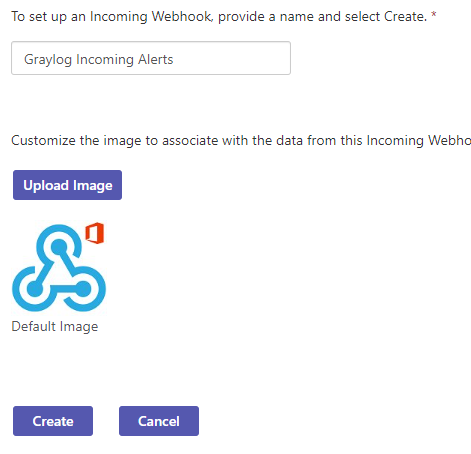
Copy the URL that's generated and click Done.
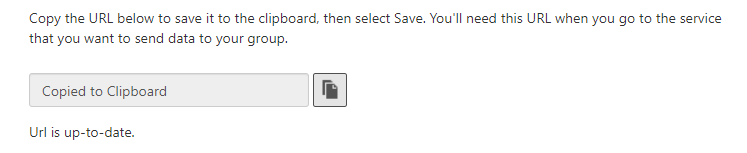
Return to Graylog.
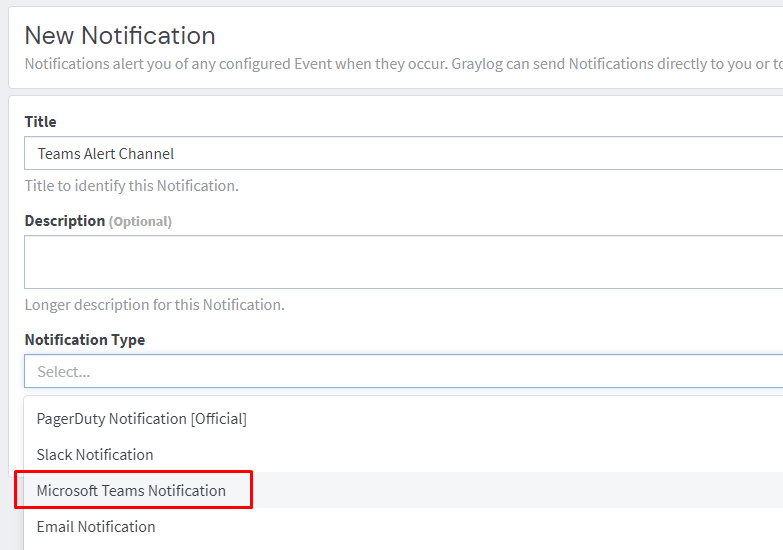
Paste the URL from earlier into the Webhook URL field and click create.
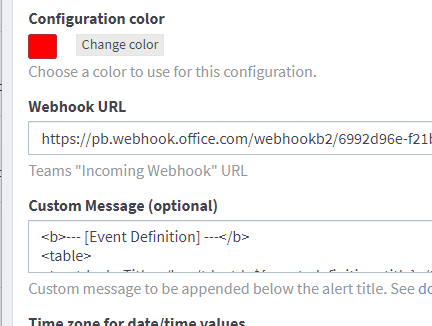
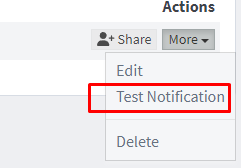
You can execute a test notification now to see if your setup steps worked.
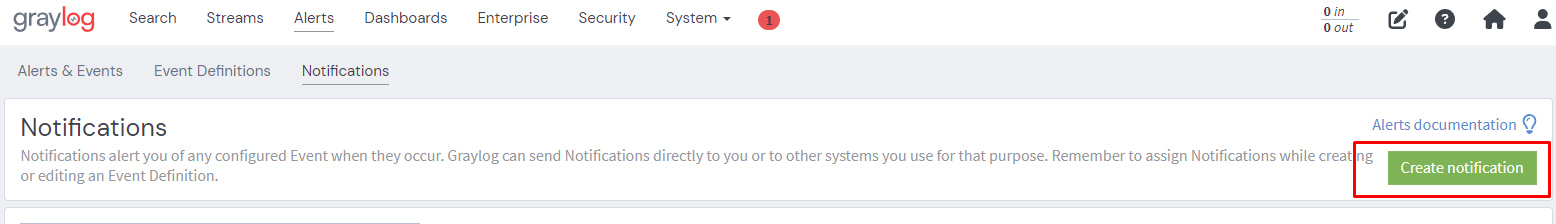
Creating an Alert
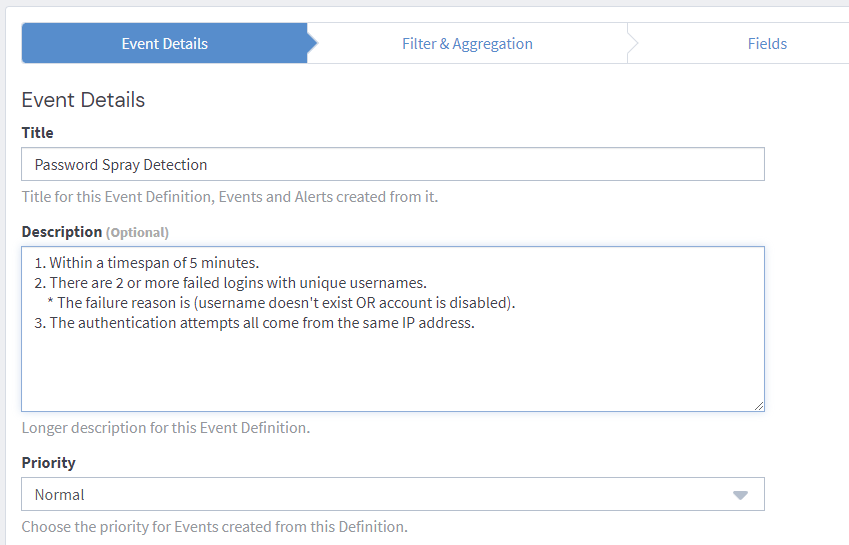
Lets setup an alert that will trigger on the following conditions:
- Within a timespan of 5 minutes.
- There are 2 or more failed logins with unique usernames.
- The failure reason is (username doesn't exist OR account is disabled).
- The authentication attempts all come from the same IP address.
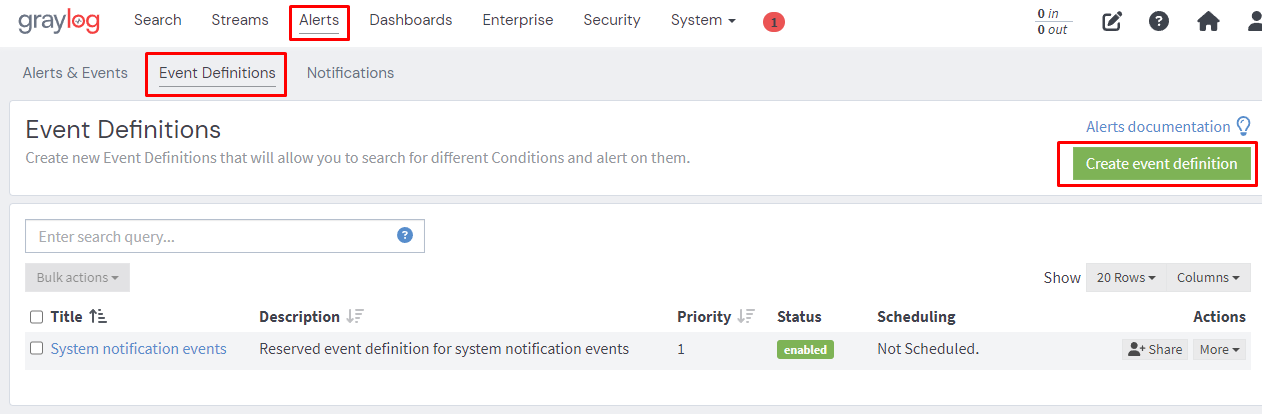
Create an Event definition.
Set our desired conditions.
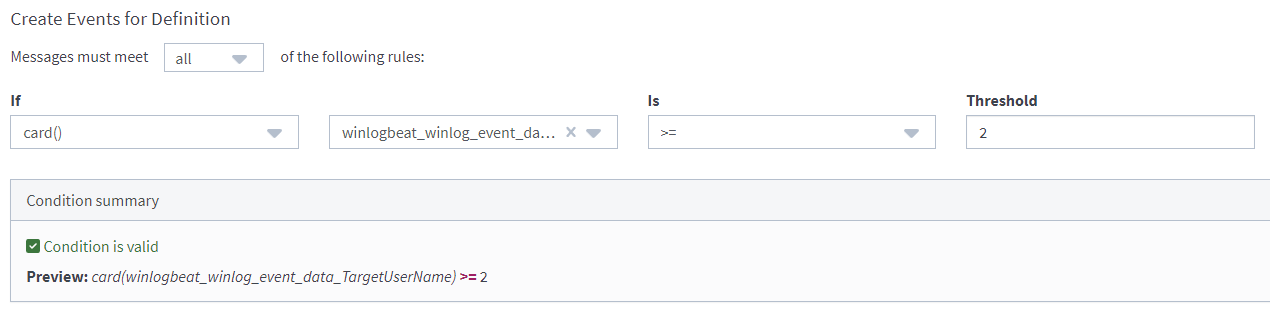
card() stands for Cardinality.
The number of elements in a set or other grouping, as a property of that grouping.
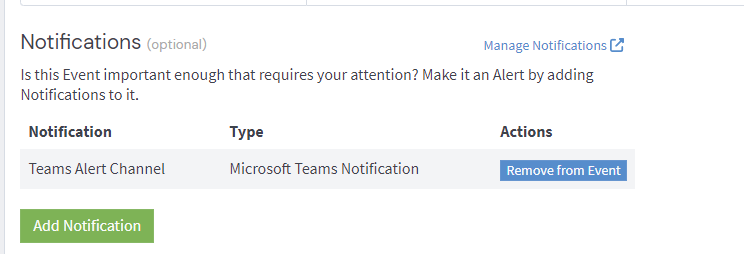
Finally set our Teams alert channel as the notification option.
Validation
Finally we're at the fun part, validating that the alert works.
Using Kali we can run a quick password spray with a short userlist (you can also do this manually yourself just by RDPing over and over with a different username).
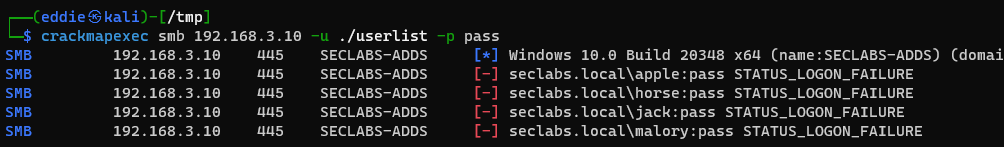
All authentications attempts are for accounts that don't exist and come from our one source IP address.
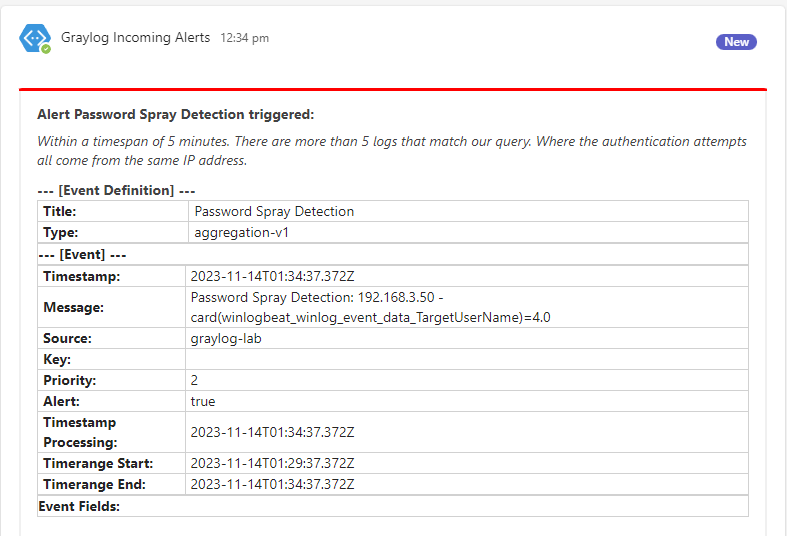
Swapping over to Teams we see a nice little notification telling us that our alert has triggered!
Conclusion
You made it!
Cybersecurity is closer to a marathon, than a sprint. This setup gets you off the starting block, but there’s a lot more road to cover. Taking the first step is key.
Building on our setup, in future blogs there's a lot more we can explore, for example:
- Creation of more detections.
- Setting up ingestion for some other common log sources (e.g. Linux, pfsense?).
- Creating dashboards and reports.
- Configuring SSL for the components installed in this blog.
- Scaling out from a single node Graylog deployment.
Let us know what you'd be interested in following along with.